igraph, network, and graph. The figure was produced with the cranet package.
R has become one of the richest environments for social network analysis. Dozens of packages on CRAN implement everything from basic centrality scores to stochastic actor-oriented models, and most of them interoperate through a small set of shared data structures.
“R for Social Network Analysis” is an opinionated tour of that ecosystem: what to reach for, when, and why. It is a practical guide to analyzing, visualizing, and modeling networks in R. The book walks through the standard descriptive toolkit, builds up ggraph-based visualizations, and covers the main families of inferential models (ERGMs, stochastic actor-oriented models, and relational event models), before closing with a tidyverse-style take on network analysis via tidygraph.
The book is aimed at researchers, students, and practitioners who already know a little R and want a guided tour of the network-analysis ecosystem without having to stitch together a dozen package vignettes themselves.
You will learn how to represent network data in R, compute the standard descriptive quantities (density, distance, centrality, community structure), produce publication-quality visualizations with ggraph, and fit inferential models such as ERGMs, SAOMs, and relational event models to test hypotheses about how networks form and evolve. The emphasis throughout is on doing: each method is introduced alongside the code needed to run it and the output to expect.
After this introduction, Network Data and Analysis motivates the network perspective and covers the foundations: nodes, edges, attributes, the common matrix and edge-list representations, and how to import or construct a network in igraph. It is the one chapter the rest of the book assumes you have read.
From there the book splits into four parts:
ggraph, with chapters on layouts, aesthetic mappings, visual enhancements, and interactive output via g6R.tidygraph, which layers tidyverse semantics on top of igraph.The parts are largely self-contained, so you can read the book linearly or skip to whichever topic is closest to the problem in front of you.
This is a book about doing network analysis in R, not a textbook on network theory or graph algorithms. We introduce sufficient theory to use each method responsibly and point to canonical references for deeper treatments. We also do not cover network analysis in Python, Gephi, or other GUI-driven tools, and we do not teach base R or the tidyverse from scratch. If you need a primer on either, R for Data Science (2e) is a good companion.
We assume you are generally numerically literate and have some basic programming experience. If you have never programmed before, Hands-On Programming with R is a useful adjunct to this book.
You need four things to run the code in this book: R, an IDE, a handful of core network packages, and a supporting cast of packages used in individual chapters.
Install R from CRAN at https://cloud.r-project.org. A new major version comes out once a year, with two or three minor releases in between. We recommend R 4.5.3 for this book.
We make no assumption about your development environment. RStudio (https://posit.co/download/rstudio-desktop/) is a popular choice and integrates well with the RStudio addins we occasionally reference, but VS Code, Positron, Emacs, or Vim will all work.
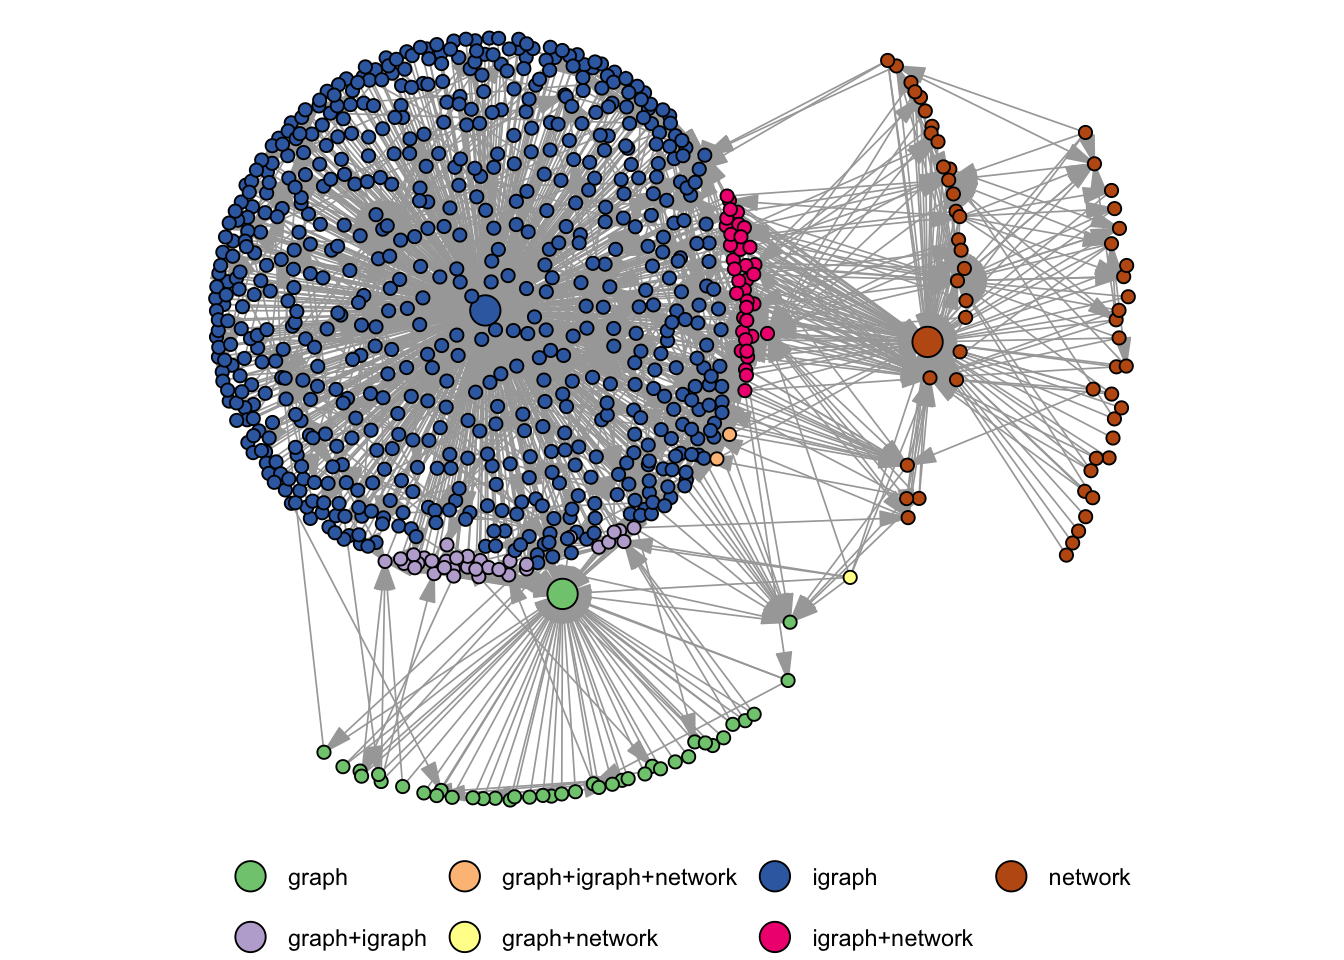
Two package families dominate network analysis in R: igraph (Csárdi and Nepusz 2006) and the statnet family (Hunter et al. 2008), which centers on the network data structure and includes sna, ergm, and other modeling packages. Both provide their own graph class and a broadly overlapping set of analytic methods. For descriptive analysis they are largely interchangeable, but each owns a different corner of inferential modeling. igraph is generally faster, since its algorithms are implemented in C, and it has attracted more downstream packages. Figure 1 shows how many CRAN packages depend on, import, or suggest igraph, network, and graph, a package only available via Bioconductor.
igraph, network, and graph. The figure was produced with the cranet package.
Because of this imbalance, igraph is the default in the Descriptive Network Analysis and Network Visualization parts. The Inferential Network Analysis part leans on network and statnet, since ergm and its companions are built on top of network. The intergraph package converts between the two representations, and we use it whenever we need to move between ecosystems.
Beyond the two core families, the book uses a number of specialized packages. The most important are:
ggraph (Pedersen 2025): grammar-of-graphics for network visualization.graphlayouts (Schoch 2023a): advanced layout algorithms for networks.tidygraph (Pedersen 2024): a tidyverse-style interface to igraph.netrankr (Schoch 2022a): a unified framework for centrality indices.signnet (Schoch 2023b): methods for signed networks.backbone (Neal 2022): backbone extraction from weighted and two-mode networks.netropy (Shafie 2026): statistical entropy analysis of network data.RSiena (Snijders et al. 2026): stochastic actor-oriented models for longitudinal networks.relevent (Butts 2023): relational event models.egor (Krenz et al. 2025): ego-centered network data.networkdata (Schoch 2022b): a large collection of network datasets used throughout the book.Each chapter lists the libraries it loads at the top, so you can install packages as you go rather than upfront. To check which versions of the core and supporting packages we used to produce the book, see Table 1.
| package | version |
|---|---|
| igraph | 2.3.2.9008 |
| ggraph | 2.2.2 |
| graphlayouts | 1.2.3 |
| tidygraph | 1.3.1.9000 |
| netrankr | 1.2.4 |
| signnet | 1.0.6 |
| backbone | 3.0.3 |
| netropy | 0.3.0 |
| RSiena | 1.6.6 |
| relevent | 1.2.1 |
| egor | 1.25.10 |
| networkdata | 0.2.4 |
| statnet | 2019.6 |